ATS Sydney PWC Presentation: Australian Entertainment & Media Outlook
by Ciaran O'Kane on 14th Mar 2012 in News


Megan Brownlow is Executive Director & Editor of The Media and Entertainment Outlook at PriceWaterhouseCooper. She recently gave an overview of upcoming trends in the Australian advertising market during a fireside chat with Paul Fisher, CEO of IAB Australia, and Stuart Spiteri, COO of News Digital Media, at this year's ATS Sydney event. The slides and synopsis of the presentation below gives some insight into how PWC sees the various online and offline advertising markets in Australia growing over the next few years.
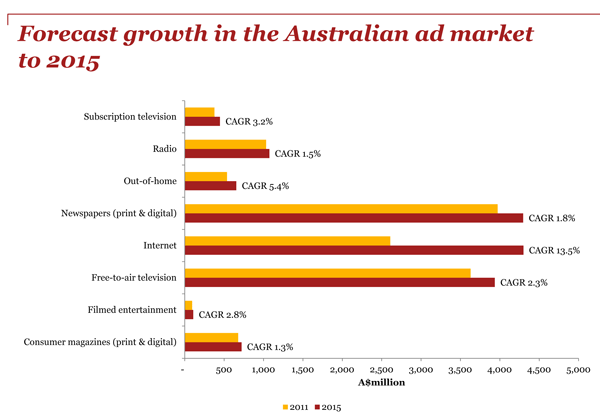
Slide 1 – Forecast growth in the Australian advertising market to 2015
These advertising expenditure forecasts are from PwC’s annual industry report, the Entertainment & Media Outlook. The current edition, from where these forecasts are drawn, looks at 2011-2015.
The key metric here is CAGR, compound annual growth rate. This shows how much growth each sector will average per year during the five year period. You can see on this graph that internet advertising will have the fastest growth rate. At 13.5% we expect it to grow faster than any other sector. What’s interesting is that this growth rate will propel internet advertising into being the lead sector – the biggest advertising sector – by 2015.
We expect revenues to reach $4.3 billion by then. Another interesting note is the health of the oldest form of advertising, outdoor media. We expect outdoor (called out-of-home here) to achieve a CAGR of 5.4%. There are a few factors driving this expected growth, but one is outdoor’s opportunity to integrate campaigns with what is perhaps the newest form of advertising – internet-connected “smart” phones.
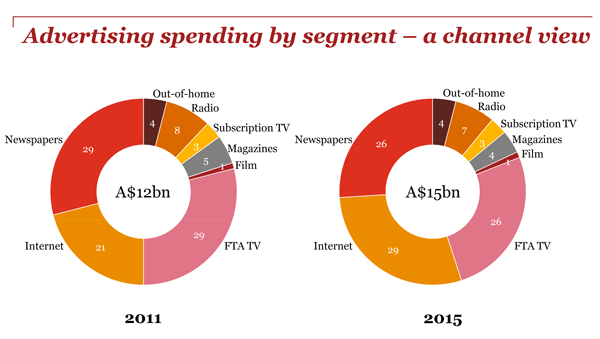
Slide 2 – Advertising spending by segment – a channel view
Here’s the Australian advertising market by share, as it is today and as we expect it to be in 2015.
We’ve taken a channel or platform view here, which means that online advertising revenues secured by newspaper publishers, magazine publishers and television joint venture partners have been removed from those sectors as they appear in this chart and placed in the internet section.
As you’d expect when taking this view, we see the relentless share growth of internet advertising, from a 21% share to a 29% share by 2015. And of course we see the traditional sectors declining, especially the big two – newspapers and television. We expect each to decline from a 29% share to a 21% share.
This chart clearly represents the structural change that the Australian advertising market has been experiencing for the last decade and will continue to experience. What it doesn’t capture however is how the market is responding, especially the traditional publishers. For this reason we cut the data differently for the next chart….
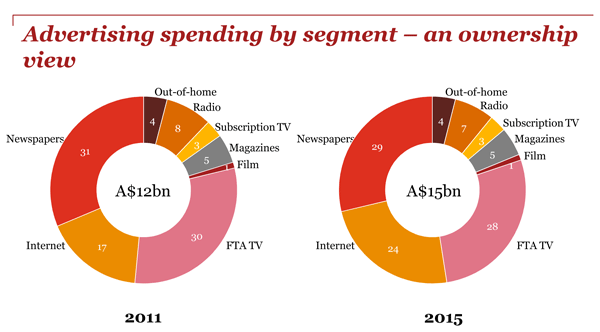
Slide 3 – Advertising spending by segment – an ownership view
Here’s another view of the same thing – the Australian advertising market as it is today and as we expect it to be in 2015. But this time we’ve taken an ownership view. That means the online advertising revenues secured by newspapers publishers, magazine publishers and television joint venture partners have been extracted from the internet sector and put back into their respective traditional sectors.
The reason we did this is because in Australia, newspaper publishers and television joint ventures like ninemsn and Yahoo!7 went into the online space early and secured attractive early mover positions with audiences.
Subsequently they also secured good spots in display advertising and are still amongst the biggest, most successful online publishers we have in Australia.
The outcome of this view is far less radical share shifting, compared to the previous slide. There’s no room for complacency however because even after you take the Australian publishers out, the internet segment still grows its share considerably – from 17% to 24%.
We put this growth down to two things – search and social. Or, to call them by their names as they are known in this market – Google and Facebook.






Follow ExchangeWire