Primis Goes Live with Intuitive New Publisher Dashboard
by on 9th Jan 2020 in News

Primis, the video discovery platform, has launched an updated new publisher dashboard.
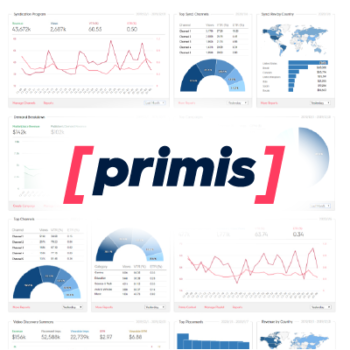
With this new dashboard, Primis publishers will be able to monitor and measure the performance of their monetisation, content and syndication activities. Syndicators, like Reuters, will be able to monitor the performance of their content across the entire Primis network at a granular level.
The publisher dashboard is comprised of 11 in-depth and intuitive, charts, tables and graphs. They map out the main metrics and data points Primis publishers use on a daily basis, and can be customized to any timeframe.
The dashboard can be broken down further into the four main elements of Primis’s publisher and syndication partners:
- Overall monetisation
- Content performance and engagement
- Demand drilldown
- Syndication program
As part of the new innovative dashboard, each chart or graph has a link to the most used actions associated with the topic. For example, you can find links for creating or managing a campaign in the Demand Breakdown graph, buttons for the Primis library, manage playlists in the Content Summary graph, and many other helpful tips. In addition, every graph and chart offers a link to more in-depth reporting.
“We are dedicated to putting our publishers’ needs first.” Said Nusya Liamin, R&D Head of Web at Primis, “We know that data plays an integral role in their strategies and are excited to provide actionable insights in a dashboard that is both transparent and intuitive.”


Follow ExchangeWire